The Chicago Board Options Exchange Volatility Index, or VIX, is an index that gauges the volatility investors expect in the U.S. stock market. The index doesn’t reflect current or recent stock volatility. Rather, it’s a leading indicator that measures the level of stock market volatility expected by investors. In this article, we’ll delve into what the VIX measures, how it’s calculated, and whether you should use it in your investment decisions.

VOLATILITYINDICES: ^VIX
Key Data Points
How does the VIX work?
You may hear the CBOE VIX referred to as the “fear gauge” or “fear index.” Developed by the Chicago Board Options Exchange (CBOE) in 1993, it measures how much fluctuation investors predict in the S&P 500 index over the next 30 days. A low VIX indicates that investors aren’t predicting major price swings in the short term; a spike in the VIX means investors predict a spike in stock market volatility.
We’ll spare you the complicated math involved in the CBOE VIX formula. But to understand how the Volatility Index works, it’s helpful to have a basic understanding of options trading. When you purchase options, you’re buying the right (but not the obligation) to buy or sell a stock at a specified date and price. For many traders, options are used for hedging. In times of uncertainty, investors will pay a premium for what’s essentially a form of insurance. Higher options prices across the overall stock market indicate that investors expect heightened volatility.
The VIX is calculated using average weighted real-time call and put prices across the S&P 500 index with an expiration date of between 23 and 37 days out. The result gives you the implied 30-day volatility of the S&P 500 index. Because the S&P 500 index represents about 80% of the value of U.S. stocks, the VIX is used as a gauge of uncertainty in the overall U.S. stock market.
Historical VIX levels
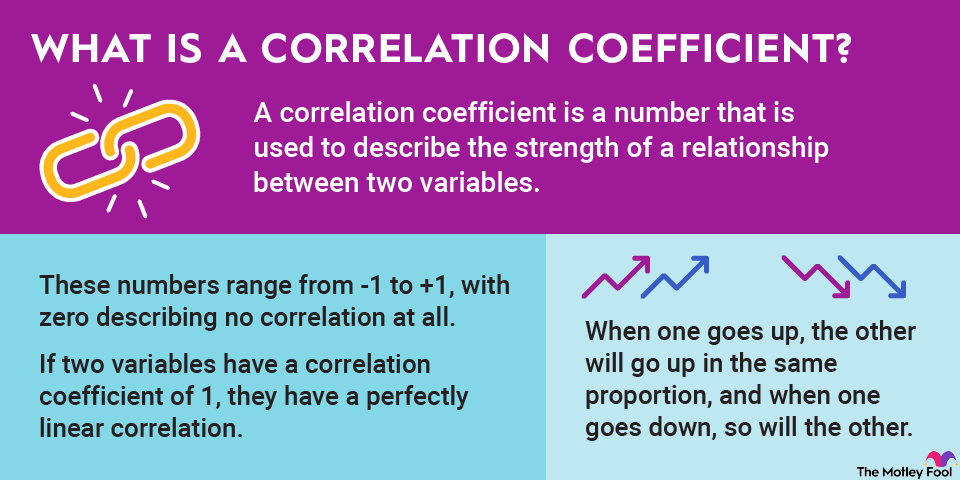
The VIX is negatively correlated with stock market performance. In other words, the index rises in times of turbulence. Here’s a rough estimate of what VIX levels tell us:
- 0-15: Low; indicates general optimism.
- 15-20: Moderate; indicates normal market conditions.
- 20-25: Medium; suggests growing concerns about the market.
- 25-30: High; indicates market turbulence.
- 30+: Extremely high; indicates extreme turbulence.
During winter 2013, a time of strong stock market performance, the VIX was at around 12. But in March 2020, as a global panic about the COVID-19 pandemic peaked, the index reached a record 82.69.
It’s important to emphasize, however, that the VIX measures implied volatility, i.e., the level of volatility the market is anticipating. Although the index can provide helpful information, investor sentiment isn’t always correct. In fact, the VIX tends to overestimate market volatility by about 4% to 5% on average, according to Fidelity.
Related investing topics
Examples of how investors use the volatility index
It’s not possible to invest directly in the VIX or in any other market index. But here’s where it gets complicated: Traditional market indexes such as the S&P 500 have index funds that track their benchmark index’s performance. When you buy an S&P 500 index fund, you’re essentially buying a basket of the 500 stocks in the index.
However, it’s impossible to purchase a basket of securities that track the VIX. It’s possible to buy futures contracts or exchange-traded funds (ETFs) and exchange-traded notes that own these futures contracts in an effort to mirror the index. Because the volatility index tends to rise when the S&P 500 falls, investors might do so if they’re bearish on the stock market. Or they may take a position in a VIX-linked product for portfolio diversification or as a hedging strategy.
But VIX-tracking funds are typically used by day traders and tend to be extraordinarily risky. Buy-and-hold investing tends to yield the best results. The VIX can help investors predict short-term performance, but the fluctuations shouldn’t concern long-term investors.
About the Author