
Lightspeed Commerce
(NYSE) LSPD
Lightspeed Commerce Financials at a Glance
Market Cap
$1.23B
Revenue (TTM)
$1.19B
Net Income (TTM)
$692.61M
EPS (TTM)
$-4.62
P/E Ratio
-1.94
Dividend
$0.00
Beta (Volatility)
2.06 (High)
Dividend
$0.00
Beta (Volatility)
2.06 (High)
Price
$8.96
Volume
13,771
Open
$9.09
Price
$8.96
Volume
13,771
Open
$9.09
Previous Close
$8.96
Daily Range
$8.80 - $9.09
52-Week Range
$7.34 - $14.34
Dividend
$0.00
Beta (Volatility)
2.06 (High)
Price
$8.96
Volume
13,771
Open
$9.09
Previous Close
$8.96
Daily Range
$8.80 - $9.09
52-Week Range
$7.34 - $14.34
LSPD News
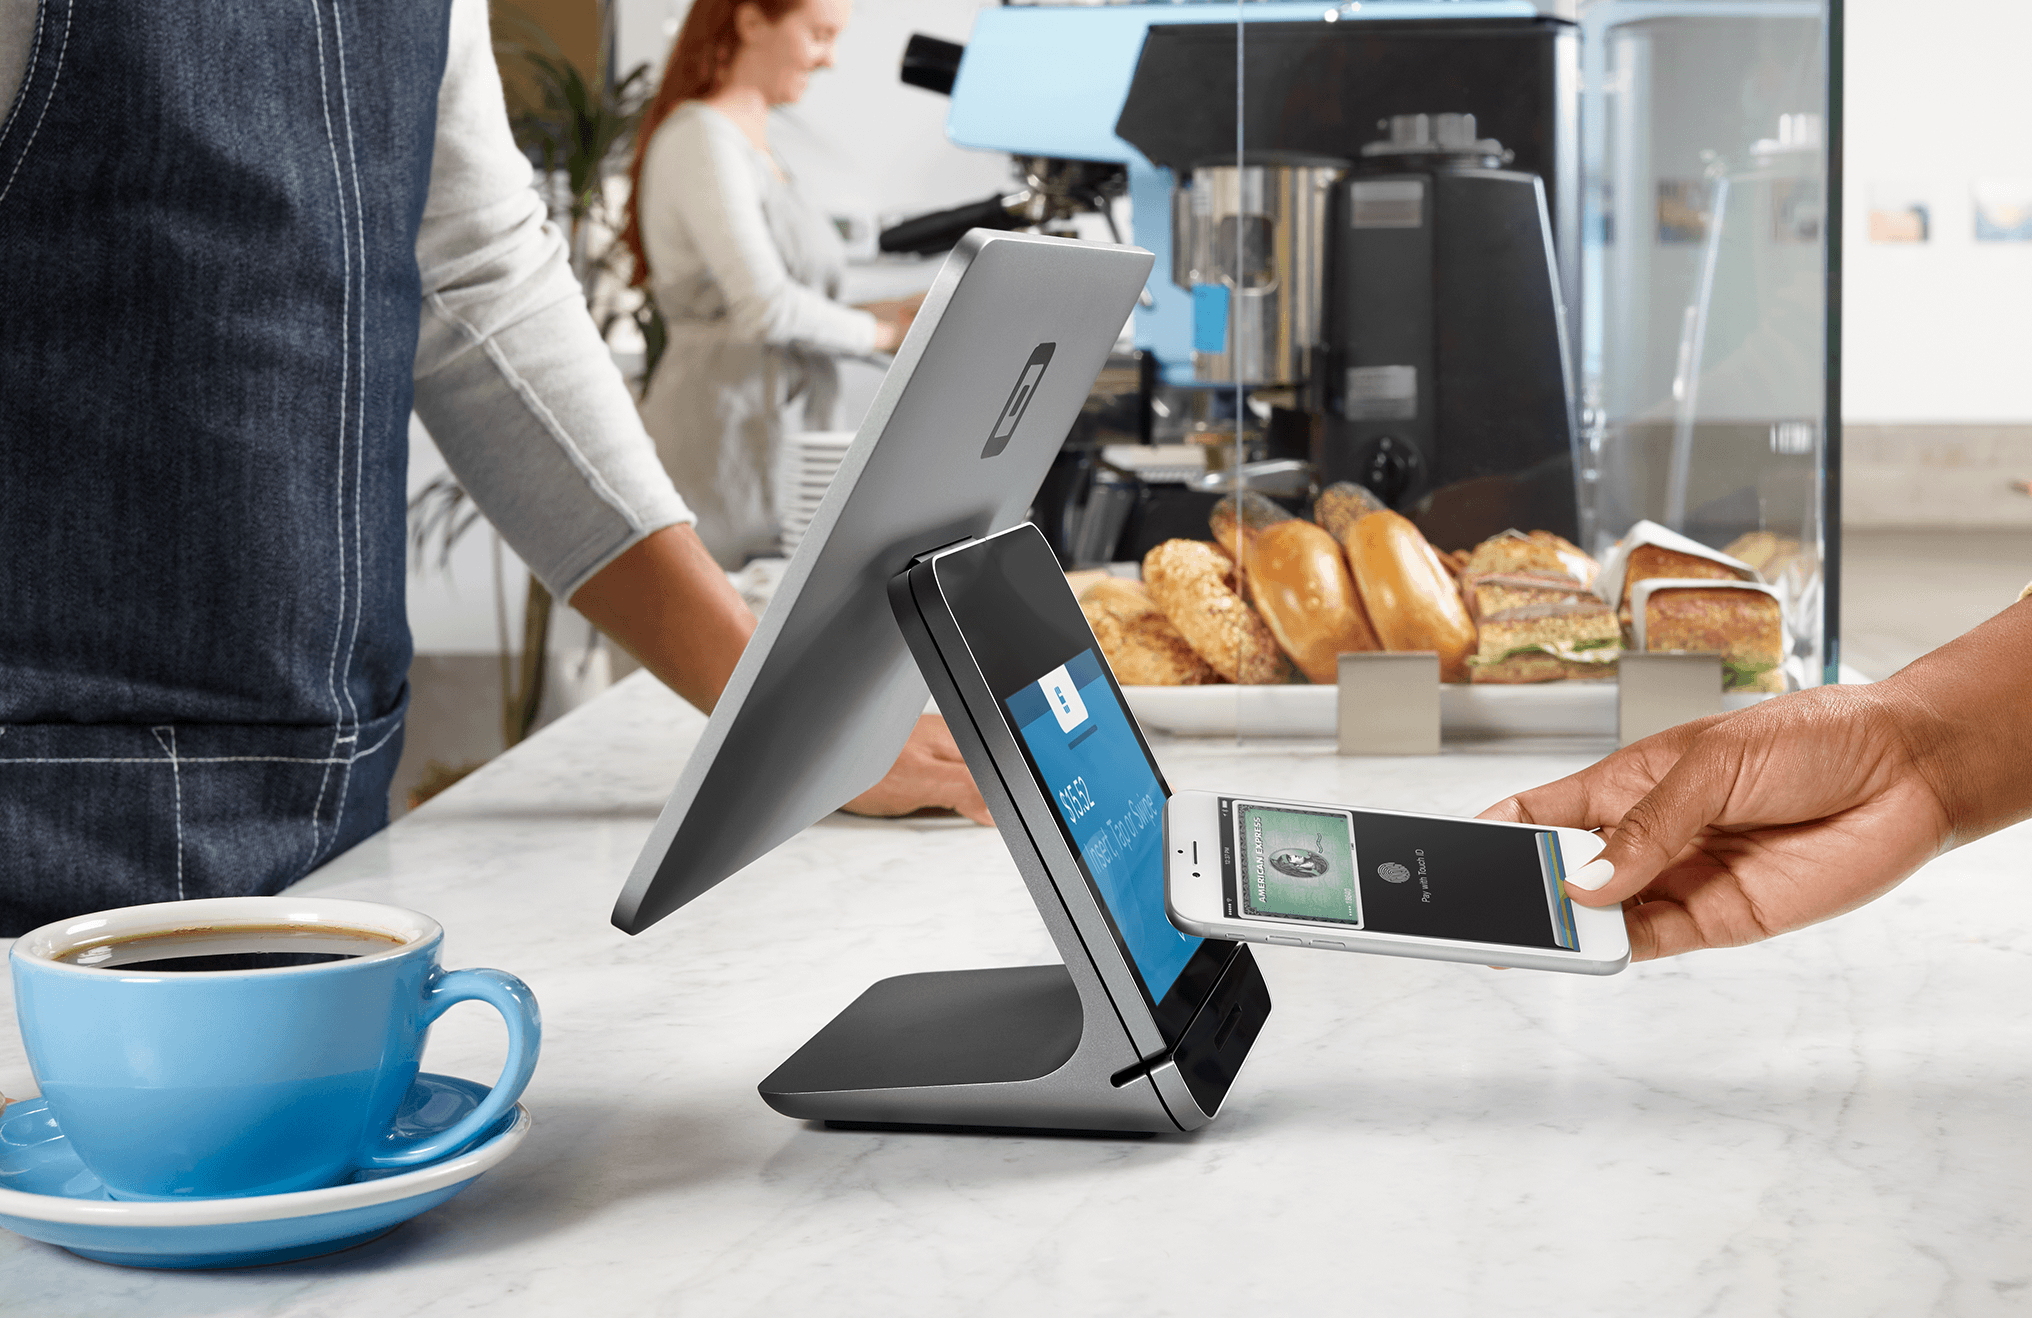
What Is a Point-of-Sale System?

What Is Solana (SOL)?


LSPD: Motley Fool Moneyball Superscore
Our CEO Is Handing Members His Secret Weapon
It's called Motley Fool Moneyball, our new proprietary AI tool
We spent over half a million dollars in R&D to build a tool that makes stock research faster, sharper, and smarter. Our analysts use it every day, and now, you can too.
Get Access NowAbout Lightspeed Commerce
Industry
Software
Sector
Information TechnologyEmployees
3,000
CEO
Dax Dasilva
Website
www.lightspeedhq.comHeadquarters
Montreal, QC H2Y 1A6, CA
LSPD Financials
Key Financial Metrics (TTM)
Gross Margin
40%
Operating Margin
-58%
Net Income Margin
-58%
Return on Equity
-36%
Return on Capital
-46%
Return on Assets
-41%
Earnings Yield
-51.55%
Dividend Yield
0.00%
Payout Ratio
0.00%
Stock Overview
Market Cap
$1.23B
Shares Outstanding
137.30M
Volume
13.77K
Short Interest
0.00%
Avg. Volume
960.32K
Financials (TTM)
Gross Profit
$450.20M
Operating Income
$696.01M
EBITDA
$557.04M
Operating Cash Flow
$32.76M
Capital Expenditure
$23.12M
Free Cash Flow
$55.88M
Cash & ST Invst.
$558.47M
Total Debt
$16.97M
Lightspeed Commerce Performance Analysis
Revenue Growth Rate
Annual and quarterly growth comparisonEarnings Per Share Growth Rate
Annual and quarterly EPS growth comparisonQuarterly Performance
Revenue
$312.35M
+11.5%
Gross Profit
$133.58M
+15.3%
Gross Margin
42.77%
N/A
Market Cap
$1.23B
N/A
Market Cap/Employee
$409.16K
N/A
Employees
3,000
N/A
Net Income
$33.58M
-26.3%
EBITDA
$240.00K
+400.0%
Quarterly Fundamentals
Net Cash
$458.79M
-28.6%
Accounts Receivable
$145.78M
+141.1%
Inventory
$12.09M
-23.8%
Long Term Debt
$14.80M
+14.1%
Short Term Debt
$5.41M
-12.7%
Return on Assets
-41.33%
N/A
Return on Invested Capital
-45.97%
N/A
Free Cash Flow
$23.90M
+803.2%
Operating Cash Flow
$66.84M
+2357.3%