



Out Now
Motley Fool Stock Advisor’s list of
Top 10 Stocks to BUY NOW
These are the stocks our analysts believe are the best positioned to beat the market and they selected them using the same method to beat the S&P 500 by 4x over the last 20+ years.
Don’t miss out. 5 years from now you’ll probably wish you’d bought these stocks.
Stock Advisor Returns
+956%
S&P 500 Returns
+192%
Cumulative Growth of a $10k Investment in Stock Advisor
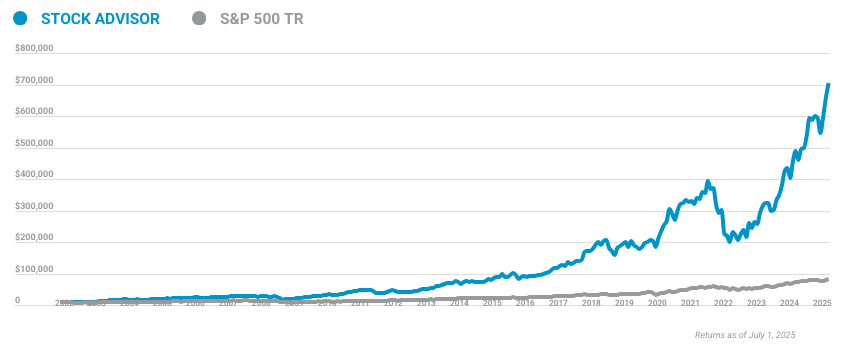
Calculated by Time-Weighted Return since 2002. Volatility profiles based on trailing-three-year calculations of the standard deviation of service investment returns.
*Stock Advisor returns as of March 10, 2026.
Tom Gardner: 5 Stocks to Hold for 5+ Years
Tom Gardner names five stocks to hold for at least five years.
He explains structural demand drivers and warns investors to expect interim 20 to 30 percent drawdowns.
Investing Solutions Designed To Make Money Over The Long Term
The Motley Fool offers a range of services designed to help you achieve your financial goals. We recommend investors buy 50 stocks and hold them for at least 5 years.
Stock Advisor
Introduction to TMF’s investing philosophy, backed by monthly stock recommendations, our top ETFs, and core financial planning guidance.
- 2 stock picks every month
- Access to top 10 stock to buy now
- AI-Powered stock rankings with Moneyball
- Monthly stock rankings, foundational stocks, Fool24 live coverage, limited access to FoolIQ, GamePlan, and more.
Epic
The home plate for individual investors, equipped with the Epic Portfolio, monthly stock picks, and AI-powered tools and research to supercharge your investing journey.
- 5 stock picks every month
- Access to top 10 stock to buy now
- AI-Powered stock rankings with Moneyball
- NEW Epic Portfolio and Match Calculator
- Monthly stock rankings, foundational stocks, Fool24 live coverage
- + Quant 5Y scoring, expanded top stock rankings, portfolio allocation, full access to FoolIQ & GamePlan.
Epic Plus
Unlock additional research and recommendations, covering trends, international, value, options trading, and an introduction to Tom Gardner’s portfolio management.
- 8 stock picks + Daily Moneyball Recs
- Access to top 10 stock to buy now
- AI-Powered stock rankings with Moneyball & Moneyball Daily Stock Picks (250+ Annually!)
- NEW Epic Portfolio and Match Calculator
- Monthly stock rankings, foundational stocks, Fool24 live coverage
- Quant 5Y scoring, expanded top stock rankings, portfolio allocation, full access to FoolIQ & GamePlan.
- Full access to AI Innovation Database (AIball), options trading strategies, access to model portfolios for Moneymakers & AI Playbook, and more.
$1,999 / year
Sign Up TodayAbout The Motley Fool
Our Purpose: To make the world smarter, happier, and richer.
Founded in 1993 by brothers Tom and David Gardner, The Motley Fool helps millions of people attain financial freedom through our website, podcasts, books, newspaper column, radio show, and premium investing services. We believe that investing is empowering, enriching, and fun. We look forward to joining you on your journey to financial independence. Learn More
The Motley Fool Investing Philosophy
Learn How We Invest- #1Buy 50+ Companies Over Time
- #2Hold Stocks for 5+ Years
- #3Add New Savings Regularly
- #4Hold Through Market Volatility
- #5Let Your Winners Run
- #6Target Long-Term Returns


