
Oklo
(NYSE) OKLO
Oklo Financials at a Glance
Market Cap
$10.07B
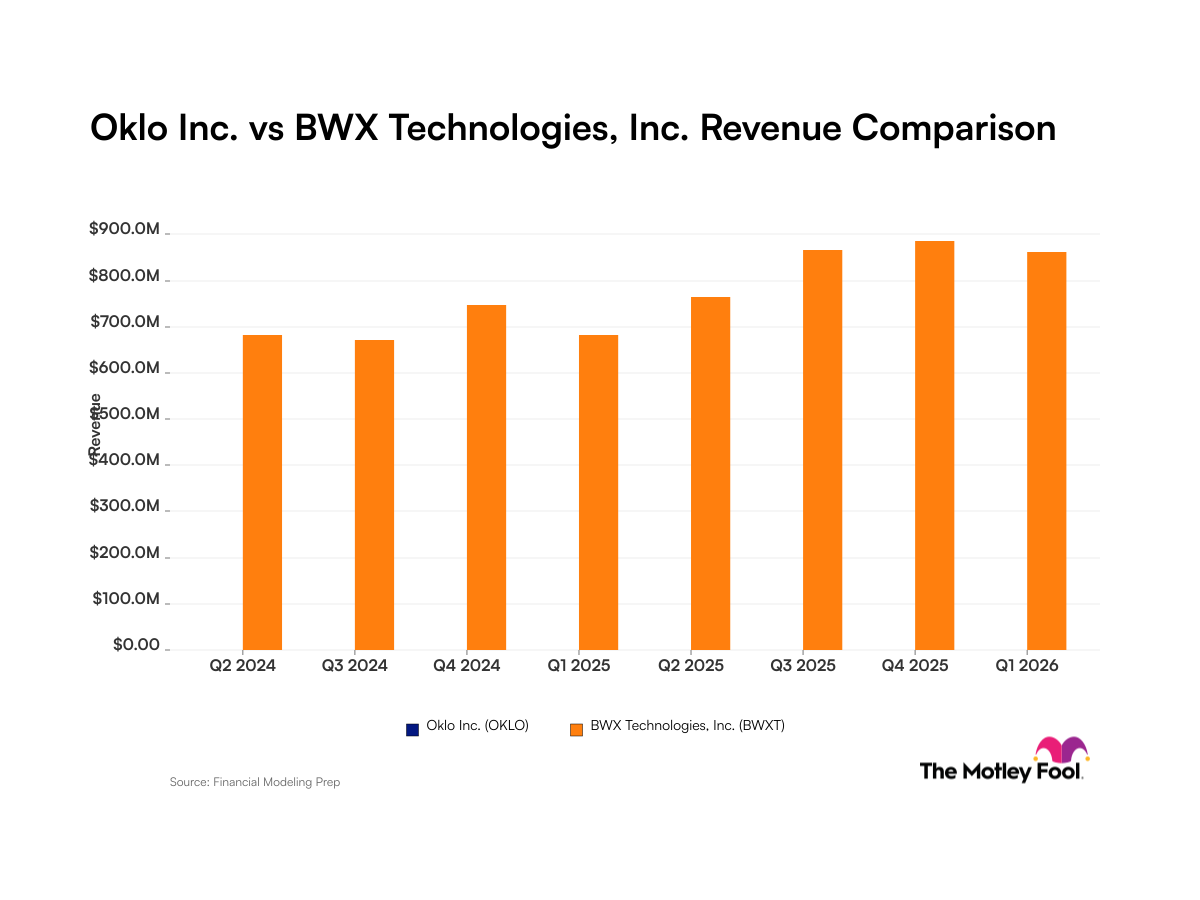
Revenue (TTM)
$0.00
Net Income (TTM)
-$128.92M
EPS (TTM)
-$0.84
P/E Ratio
-68.83
Dividend
$0.00
Beta (Volatility)
1.09 (Average)
Dividend
$0.00
Beta (Volatility)
1.09 (Average)
Price
$57.39
Volume
8,173,141
Open
$58.05
Price
$57.39
Volume
8,173,141
Open
$58.05
Previous Close
$57.49
Daily Range
$55.88 - $58.58
52-Week Range
$44.88 - $193.84
Estimated Earnings Date
Aug 10, 2026
Dividend
$0.00
Beta (Volatility)
1.09 (Average)
Price
$57.39
Volume
8,173,141
Open
$58.05
Previous Close
$57.49
Daily Range
$55.88 - $58.58
52-Week Range
$44.88 - $193.84
Estimated Earnings Date
Aug 10, 2026
OKLO News

Why Oklo Stock Powered Higher Today


OKLO: Motley Fool Moneyball Superscore
Our CEO Is Handing Members His Secret Weapon
It's called Motley Fool Moneyball, our new proprietary AI tool
We spent over half a million dollars in R&D to build a tool that makes stock research faster, sharper, and smarter. Our analysts use it every day, and now, you can too.
Get Access NowAbout Oklo
Industry
Electric Utilities
Sector
UtilitiesEmployees
205
CEO
Jacob DeWitte, PhD
Website
www.oklo.comHeadquarters
Santa Clara, CA 95054, US
OKLO Financials
Key Financial Metrics (TTM)
Gross Margin
0%
Operating Margin
0%
Net Income Margin
0%
Return on Equity
-9%
Return on Capital
-6%
Return on Assets
-5%
Earnings Yield
-1.45%
Dividend Yield
0.00%
Payout Ratio
0.00%
Stock Overview
Market Cap
$10.07B
Shares Outstanding
173.99M
Volume
8.17M
Avg. Volume
13.29M
Financials (TTM)
Gross Profit
$0.00
Operating Income
-$139.29M
EBITDA
-$109.67M
Operating Cash Flow
-$82.17M
Capital Expenditure
-$33.21M
Free Cash Flow
-$115.38M
Cash & ST Invst.
$1.23B
Total Debt
$1.45M
Oklo Performance Analysis
Revenue Growth Rate
Annual and quarterly growth comparisonCurrently no data to display.
Earnings Per Share Growth Rate
Annual and quarterly EPS growth comparisonQuarterly Performance
Revenue
$0.00
N/A
Gross Profit
-$163.00K
N/A
Gross Margin
0.00%
N/A
Market Cap
$10.07B
N/A
Market Cap/Employee
$83.89M
N/A
Employees
120
N/A
Net Income
-$33.06M
-237.1%
EBITDA
-$29.75M
-111.0%
Quarterly Fundamentals
Total Cash
$2.21B
+998.7%
Total Debt
$2.62M
+27.6%
Accounts Receivable
$0.00
-100.0%
Inventory
$0.00
N/A
Long Term Debt
$1.59M
+42.9%
Short Term Debt
$1.03M
+9.6%
Return on Assets
-4.77%
N/A
Return on Invested Capital
-6.48%
N/A
Free Cash Flow
-$50.68M
-303.0%
Operating Cash Flow
-$17.87M
-45.9%