
Palo Alto Networks
(NASDAQ) PANW
Palo Alto Networks Financials at a Glance
Market Cap
$227.87B
Revenue (TTM)
$10.61B
Net Income (TTM)
$842.80M
EPS (TTM)
$1.22
P/E Ratio
229.70
Dividend
$0.00
Beta (Volatility)
1.20 (Average)
Dividend
$0.00
Beta (Volatility)
1.20 (Average)
Price
$279.47
Volume
9,832,316
Open
$269.86
Price
$279.47
Volume
9,832,316
Open
$269.86
Previous Close
$279.25
Daily Range
$269.00 - $280.72
52-Week Range
$139.57 - $302.95
Estimated Earnings Date
Aug 17, 2026
Dividend
$0.00
Beta (Volatility)
1.20 (Average)
Price
$279.47
Volume
9,832,316
Open
$269.86
Previous Close
$279.25
Daily Range
$269.00 - $280.72
52-Week Range
$139.57 - $302.95
Estimated Earnings Date
Aug 17, 2026
PANW News


PANW: Motley Fool Moneyball Superscore
Our CEO Is Handing Members His Secret Weapon
It's called Motley Fool Moneyball, our new proprietary AI tool
We spent over half a million dollars in R&D to build a tool that makes stock research faster, sharper, and smarter. Our analysts use it every day, and now, you can too.
Get Access NowAbout Palo Alto Networks
Industry
Software
Sector
Information TechnologyEmployees
16,068
CEO
Nikesh Arora, MBA
Website
www.paloaltonetworks.comHeadquarters
Santa Clara, CA 95054, US
PANW Financials
Key Financial Metrics (TTM)
Gross Margin
72%
Operating Margin
10%
Net Income Margin
8%
Return on Equity
5%
Return on Capital
3%
Return on Assets
2%
Earnings Yield
0.44%
Dividend Yield
0.00%
Payout Ratio
0.00%
Stock Overview
Market Cap
$227.87B
Shares Outstanding
816.00M
Volume
9.83M
Avg. Volume
8.35M
Financials (TTM)
Gross Profit
$6.77B
Operating Income
$1.24B
EBITDA
$1.94B
Operating Cash Flow
$3.72B
Capital Expenditure
-$246.20M
Free Cash Flow
$3.47B
Cash & ST Invst.
$2.90B
Total Debt
$338.20M
Palo Alto Networks Performance Analysis
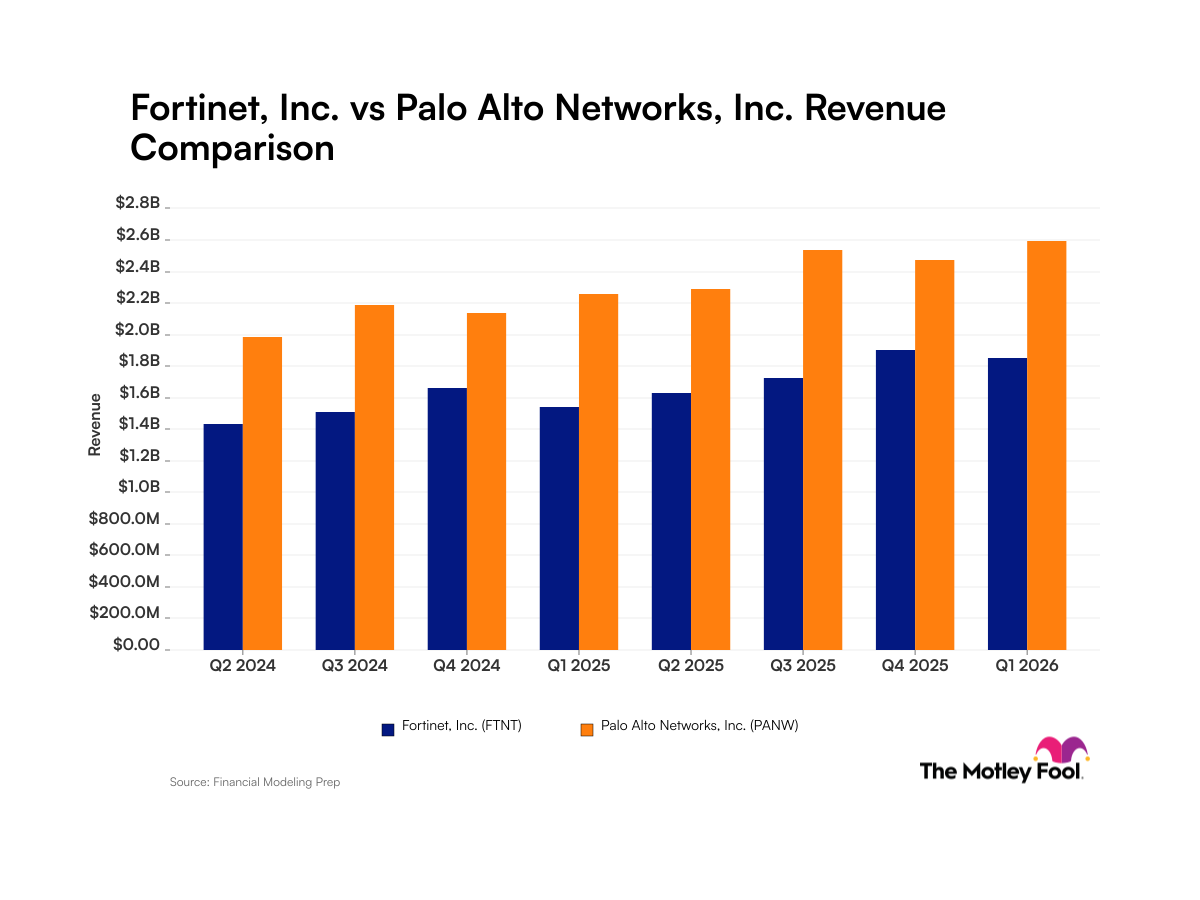
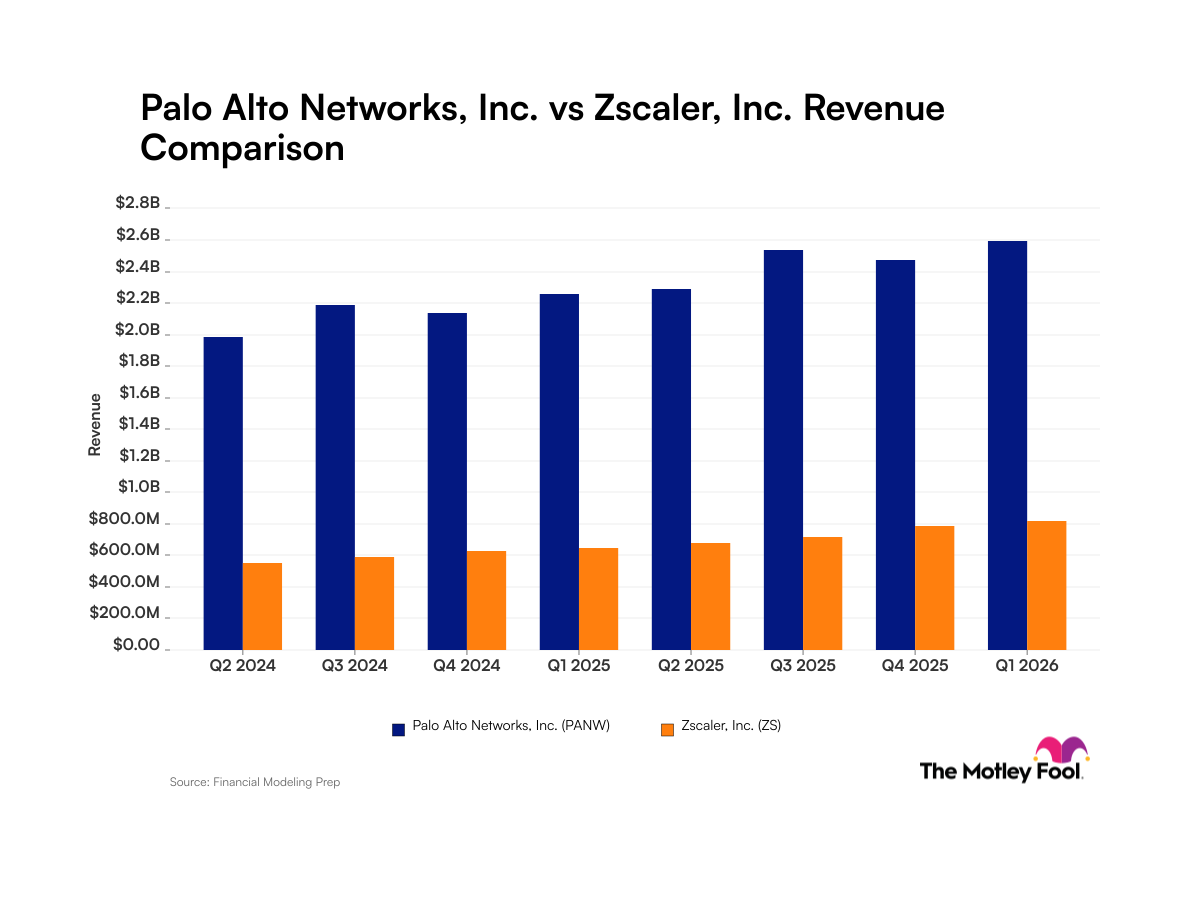
Revenue Growth Rate
Annual and quarterly growth comparisonEarnings Per Share Growth Rate
Annual and quarterly EPS growth comparisonQuarterly Performance
Revenue
$3.00B
+31.1%
Gross Profit
$2.03B
+21.5%
Gross Margin
67.55%
N/A
Market Cap
$227.87B
N/A
Market Cap/Employee
$14.46M
N/A
Employees
15,758
N/A
Net Income
-$177.00M
-167.5%
EBITDA
-$183.00M
-145.9%
Quarterly Fundamentals
Net Cash
$1.04B
-58.3%
Accounts Receivable
$3.44B
+28.1%
Inventory
$0.00
N/A
Long Term Debt
$1.91B
+452.8%
Short Term Debt
$160.00M
-65.2%
Return on Assets
1.82%
N/A
Return on Invested Capital
2.75%
N/A
Free Cash Flow
$871.00M
+55.4%
Operating Cash Flow
$871.00M
+38.5%